In the app
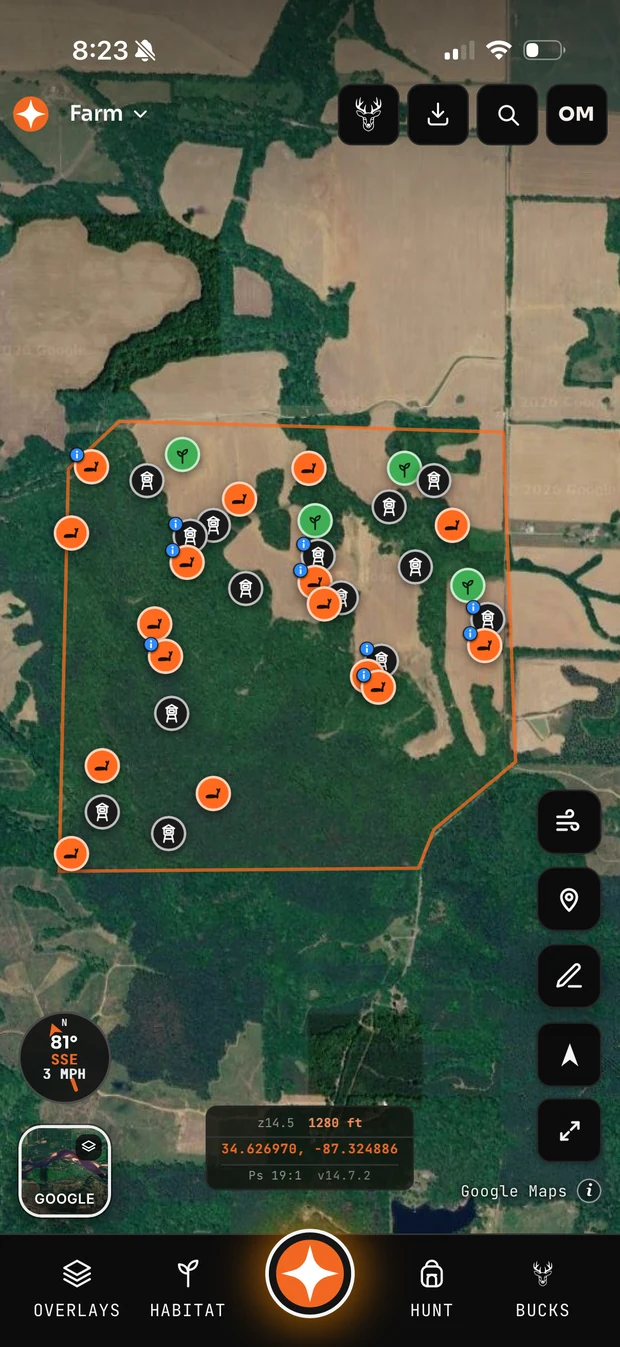
What your ground can actually hold — and roughly how many does it takes to hold it there.
| Habitat | Deer per square mile | Acres per deer |
|---|---|---|
| Poor — closed canopy | 10–15 | ~50 |
| Fair — mixed timber | 20–30 | ~26 |
| Good — early succession + ag | 35–50 | ~15 |
| Excellent — managed | 55–75 | ~10 |
The number of deer a property can biologically support is higher than the number it should hold. At the biological ceiling the herd is stressed, browse is stripped to a visible line, fawn survival falls and antler quality drops. Most managers target roughly two thirds of capacity, where deer are heavy, does raise more fawns and the habitat recovers each year.
A browse line — the height below which every palatable leaf is gone — is the clearest sign you are at or past capacity. So is a summer of small-bodied does and single fawns where twins used to be normal. Deer numbers can look fine on camera while the habitat quietly runs out of food, and cameras cluster deer at bait rather than counting them.
Two 200-acre farms with identical acreage can differ threefold in what they hold. What moves the number is food within reach, cover thick enough that deer bed rather than pass through, water, and how hard the ground is hunted. Timber that looks impressive from the road is often the poorest deer habitat on the place, because nothing grows at deer height under a closed canopy.
In the app